Sample Size
Sample Size Explained
예를 들어서 전국 30대 몸무게의 평균값을 알고 싶을때, 전체 모집단에 대해서 조사를 하기에는 물리적으로 어려움이 따릅니다.
결국 sampling을 해야 하는데, 표본집단의 숫자에 따라서 통계적 유의미성이 달라질 수 있습니다.
- 표본집단의 숫자가 작을 경우: outliers 또는 anomalies를 포함할 가능성이 있으며, 모집단을 대표하기 부족할 수 있습니다.
- 표본집단의 숫자가 많을 경우: 최대한 많은 자원과 시간을 들여서 조사를 할 수 있다면 좋지만 비용 문제가 많이 나갈 수 있습니다.
따라서 적절한 sample size를 구할 필요성이 있습니다.
Understand Sample Size
정치적 여론조사, 실험계획에서의 표본석택및 결과분석이 필요한데 표본오차를 구하고 해석하는 방법을 알고 있어야 합니다.
허경영 후보 지지율이 설문조사에서 32%의 지지율을 얻었다.
이번 조사는 전국 성인남녀 1000명을 대상으로 인터넷 설문조사로 실시되었으며, 신뢰수준 95%에서 표본오차는 ±3.0% 포인트이다
자! 여기서 신뢰수준 95%에서 표본오차 3.0%포인트라는 말의 의미가 무엇인가 입니다
쉽게 말하면 위와 동일한 설문조사를 100번 실시한다면,
95번은 허경영 후보가 32%에서 ±3.0% 인 29%~35% 사이의 지지율을 얻을 것으로 기대된다는 의미입니다.
- 신뢰수준 (Confidence Level): 표본에 의한 조사 결과의 확실성 정도를 표현하는 것. 일반적으로 0.95, 0.99가 많이 사용됩니다.
- 표본오차 (Margin of Error): 위의 신뢰수준 하에서 샘플에 의한 추정이 모집단의 측정치와 표본오차 범위만큼 차이날수 있다는 것을 의미 합니다.
Formula
\[\begin{align} \text{necessary sample size} &= \frac{y}{1+(y * \frac{1}{N})} \\ y &= \frac{Z^2_{\alpha/2} \cdot p(1-p)}{e^2} \\ \end{align}\]- \(Z_{\alpha/2}\) : 신뢰수준에 대응하는 z-score
- \(p\) : 관찰치 (the observed percentage)로서 보통 최대 표본 오차를 구하기 위해서 p=0.5를 사용
- \(e\) : 표본오차 (margin or error, confidence interval)
- \(N\) : 모집단의 크기 (population size)
Hot to Calculate
Calculate Z-Score from Confidence Level
Z-score는 아래와 같습니다.
\[Z = \frac{x-\mu}{\sigma}\]Z-score는 단순히 평균으로부터 표준편차의 몇배 정도 떨어져 있는지 이며, 그 x축의 값입니다.
이게 중요한게 아니라, 우리가 구하고자 하는것은 표준정규분포 ( \(\mu=0, \sigma=1\) ) 를 따른다고 가정할때,
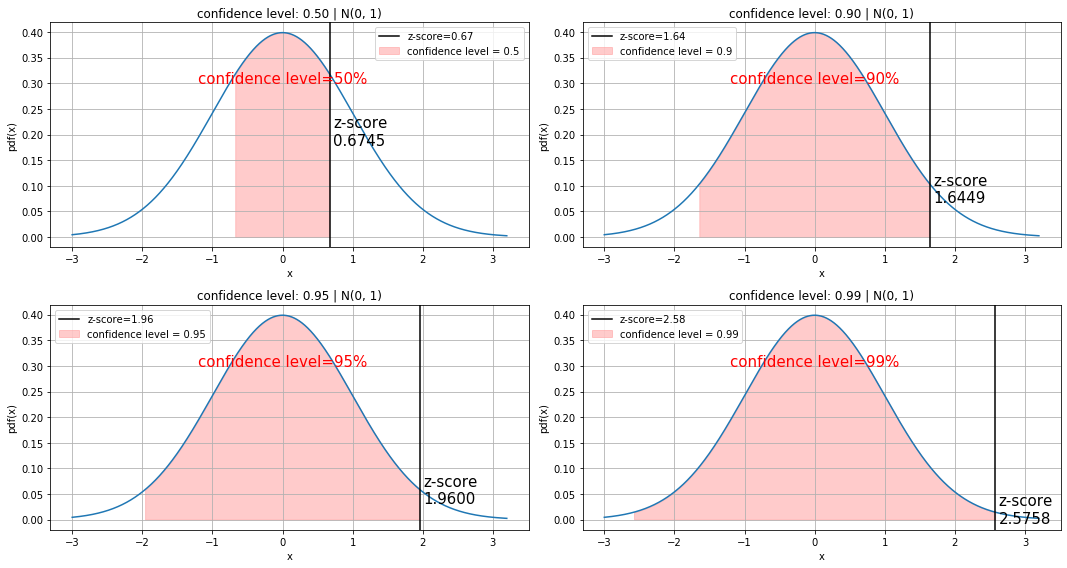
confidence level (신뢰구간. 0.9, 0.95, 0.99 같은 값들) 값으로 Z-Score 를 역으로 알아내는 것 입니다.
Z-Table 에서 Z-score를 알면 P-value를 알아낼수 있는데.. 그의 역이라고 할까..
Confidence level로 부터 Z-Score 계산을 구현하는 방법중에 쉬운 방법은 norm.ppf 를 사용하는 것입니다.
norm.ppf(p) 를 사용하면 되고, p값은 확률값 CDF값으로서 몇 퍼센트의 면적을 의미합니다.
참고로 norm.cdf(x)는 가장 왼쪽에서부터의 가로축 x까지의 면적입니다.
from scipy.stats import norm

def cal_zscore(confidence_level):
    return norm.ppf(1-(1-confidence_level)/2, loc=0, scale=1)

def cal_cdf(z_score):
    # norm.cdf는 가장 왼쪽에서부터의 누적 확률을 계산합니다.
    return norm.cdf(z_score) - norm.cdf(-z_score)

for cl in [0, 0.1, 0.5, 0.9, 0.95, 0.99]:
    z_score = cal_zscore(cl)
    print(f'confidence level {cl:4.2f} -> z-score {z_score:5.3f} | cdf:{cal_cdf(z_score):.2f}')
confidence level 0.00 -> z-score 0.000 | cdf:0.00
confidence level 0.10 -> z-score 0.126 | cdf:0.10
confidence level 0.50 -> z-score 0.674 | cdf:0.50
confidence level 0.90 -> z-score 1.645 | cdf:0.90
confidence level 0.95 -> z-score 1.960 | cdf:0.95
confidence level 0.99 -> z-score 2.576 | cdf:0.99Visualization
def visualize_z_scores():
    confidence_levels = [0.5, 0.9, 0.95, 0.99]

    fig, plots = plt.subplots(2, len(confidence_levels)//2, figsize=(15, 8))
    fig.set_tight_layout(True)
    plots = plots.reshape(-1)
    for ax, cl in zip(plots, confidence_levels):
        y_scale = norm.pdf(norm.ppf(cl))
        x = np.arange(-3, 3.2, 0.001)
        ax.plot(x, norm.pdf(x, loc=0, scale=1))
        ax.set_title(f"confidence level: {cl:.2f} | N(0, 1)")
        ax.set_xlabel('x')
        ax.set_ylabel('pdf(x)')
        ax.grid(True)

        # Calculate Z-Score
        z_score = cal_zscore(cl)
        cl_x = np.arange(-z_score, z_score, 0.01)
        ax.fill_between(cl_x, norm.pdf(cl_x), alpha=0.5, color='#ff9999',
                       label=f'confidence level = {cl}')

        ax.text(-1.2, .3, f"confidence level={int(cl*100)}%", fontsize=15, color='r')
        ax.text(z_score+0.05, y_scale/2-0.02, f"z-score\n{z_score:.4f}", fontsize=15)
        ax.axvline(z_score, 0, 1, label=f'z-score={z_score:.2f}', color='black')
        ax.legend()

visualize_z_scores()
Calculate Sample Size
from scipy.stats import norm

def cal_zscore(confidence_level):
    return norm.ppf(1-(1-confidence_level)/2, loc=0, scale=1)

def calculate_sample_size(population_size:int, cl:float, moe:float, p:float=0.5):
    """
    :param population_size: population size 모집단의 갯수 ex. 10000
    :param cl: confidence level 신뢰수준 ex. 0.95, 0.99
    :param moe: margin of error 표본 오차 ex. 0.03
    :param p: population proportion 모비율 / 보통 0.5 를 사용
    """
    assert 0 < cl < 1
    assert 0 < moe < 1
    p_n = int(population_size)
    y = cal_zscore(cl)**2 * p*(1-p)/(moe**2)
    return y/(1 + (y* 1/p_n))

sample_size = int(calculate_sample_size(10000, 0.95, 0.05))
print(f'1000명의 설문조사이며, 신뢰수준 95%에서 표본오차 ±5.0%일때 필요한 설문조사 인원은 {sample_size}명 입니다')
1000명의 설문조사이며, 신뢰수준 95%에서 표본오차 ±3.0%일때 필요한 설문조사 인원은 369명 입니다 T-Test Sample Size
Finding Effect Size (효과크기)
\[d = \frac{M_1 - M_2}{STD}\]- d : effect size
- \(M_1\), \(M_2\) : 두 집단의 평균값
두 그룹간의 평균을 빼주고 STD로 나눠준 것을 의미 \((M_2 - M_1) / STD_{pooled}\)
예를 들어서 다이어트 약을 먹을때 5Kg이 빠진다는 것은 non-standardized effect size 로서 그냥 두 집단의 평균을 빼준것이고
STD로 나눌때 effect size 값이 나옴 (effect size = standardized mean difference)
- 두 집단간의 평균 차이를 STD로 나눠준것으로 이해하면 됨
- 0.2 : Small Effect (평균적인 차이가 작다)
- 0.5 : Moderate Effect
- 0.8 :Large Effect (평균적인 차이가 크다. 모르면 그냥 0.8 사용)
아래 코드에서 effect_size를 None값으로 두었고.. None값으로 두면 해당 값을 계산해서 리턴함
from statsmodels.stats.power import TTestIndPower
analysis = TTestIndPower()
analysis.solve_power(effect_size=None, power=0.8, nobs1=30, ratio=1, alpha=0.05)
# 0.735- power : 0.8 사용하며 -> 1 - P(Type2 Error) -> Power는 만약 대립가설이 맞을때, 귀무가설을 기각할 확률을 의미.
- alpha : significance level 을 의미하며 0.05 사용. -> P(Type1 Error) -> 귀무가설이 옳았을때 귀무가설을 잘못 기각시킬 확률
- nobs1 : 그룹A 의 샘플 갯수를 의미 -> 그룹B의 샘플 갯숫는 nobs1 * ratio = nobs2 로 계산
- ratio : 그룹B 의 샘플 갯수를 계산 할때 사용
- alternative:
two-sided(default),larger,smaller-> Power 계산시 사용하며 one-sided test 는 larger 또는 smaller중에서 사용
Finding Power
- 보통 0.8로 두고 함
from statsmodels.stats.power import TTestIndPower
analysis = TTestIndPower()
analysis.solve_power(effect_size=0.8, power=None, nobs1=30, ratio=1, alpha=0.05)
# 0.861422509233477
Finding sample size
from statsmodels.stats.power import TTestIndPower
analysis = TTestIndPower()
analysis.solve_power(effect_size=0.8, power=0.8, nobs1=None, ratio=1, alpha=0.05)
# 25.52457250047935
중요 포인트는 25로 나온 결과값이 그룹A의 샘플갯수이며, ratio=1 이기 때문에 그룹B도 동일하다고 볼 수 있습니다.
전체 샘플 사이즈 갯수는..
총 필요함 sample size는 대략 50명이 됩니다.