Uber H3
Table of Cell Areas for H3 Resolutions
| H3 | Average Hexagon Area (km2) | Average Hexagon Edge Length (km) | Number of unique indexes | Distance |
|---|---|---|---|---|
| 0 | 4,250,546.8477000 | 1,107.712591000 | 122 | 1827.9519km |
| 1 | 607,220.9782429 | 418.676005500 | 842 | 719.043km |
| 2 | 86,745.8540347 | 158.244655800 | 5,882 | 242.902km |
| 3 | 12,392.2648621 | 59.810857940 | 41,162 | 105.158km |
| 4 | 1,770.3235517 | 22.606379400 | 288,122 | 39.258km |
| 5 | 252.9033645 | 8.544408276 | 2,016,842 | 13.134km |
| 6 | 36.1290521 | 3.229482772 | 14,117,882 | 5.699km |
| 7 | 5.1612932 | 1.220629759 | 98,825,162 | 2.042km |
| 8 | 0.7373276 | 0.461354684 | 691,776,122 | 700.1m |
| 9 | 0.1053325 | 0.174375668 | 4,842,432,842 | 314.2m |
| 10 | 0.0150475 | 0.065907807 | 33,897,029,882 | 116.3m |
| 11 | 0.0021496 | 0.024910561 | 237,279,209,162 | 38.3m |
| 12 | 0.0003071 | 0.009415526 | 1,660,954,464,122 | 16.3m |
| 13 | 0.0000439 | 0.003559893 | 11,626,681,248,842 | 6.4m |
| 14 | 0.0000063 | 0.001348575 | 81,386,768,741,882 | 2.4m |
| 15 | 0.0000009 | 0.000509713 | 569,707,381,193,162 | 0m |
설치및 라이브러리 불러오기
설치는 pip로 설치하면 됩니다.
pip install h3Tutorial에서 필요한 library는 다음과 같이 불러옵니다.
import branca.colormap as cm

from h3 import h3
from shapely.geometry import Point, Polygon
from geopy.distance import distance
Tutorial
Location to H3 and vice versa
gangnam = [37.508811, 127.040978]
hongdae = [37.557435, 126.925808]

gangnam_h3 = h3.geo_to_h3(gangnam[0], gangnam[1], res=5)
loc = h3.h3_to_geo(gangnam_h3)

print('강남 원래 좌표  :', gangnam)
print('강남 H3 중심좌표:', loc)
print('강남 H3       :', h3_loc)
강남 원래 좌표 : [37.508811, 127.040978]
강남 H3 중심좌표: [37.468877275742344, 127.06257021363524]
강남 H3 : 8630e1ca7ffffffdef to_polygon(l):
return Polygon(h3.h3_to_geo_boundary(l, geo_json=True))
df = gpd.GeoDataFrame({'h3': [gangnam_h3]})
df['geometry'] = df['h3'].apply(to_polygon)
df.crs = {'init': 'epsg:4326'}
display(df)
m = folium.Map(gangnam, zoom_start=12)
folium.GeoJson(df).add_to(m)
m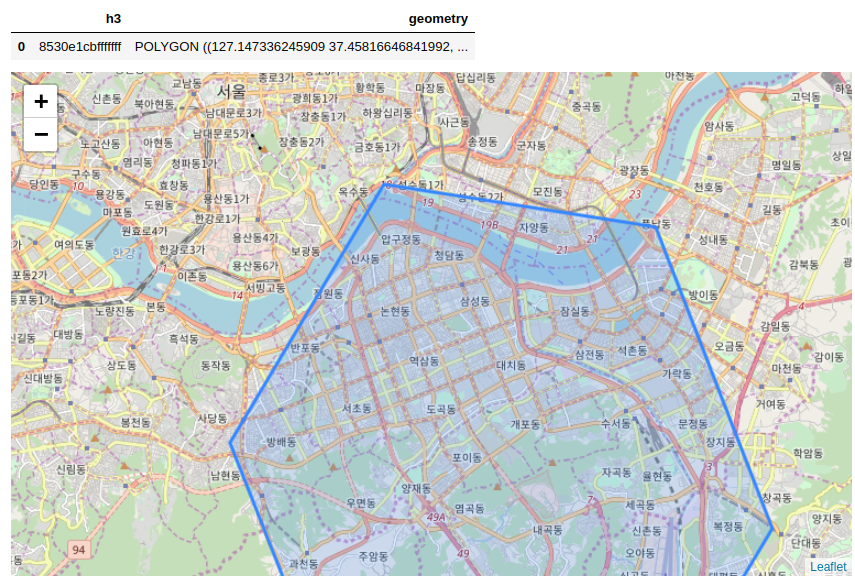
Grid Distance (H3 사이의 거리 구하기)
h3.h3_distance 함수를 사용하면 됩니다.
이때 나오는 수치는 두 H3 사이의 몇개의 grid가 있는지를 나타냅니다.
(즉 미터나, 킬러미터같은 단위가 아닙니다.)
gangnam = [37.508811, 127.040978]
hongdae = [37.557435, 126.925808]

gangnam_h3 = h3.geo_to_h3(gangnam[0], gangnam[1], res=10)
hongdae_h3 = h3.geo_to_h3(hongdae[0], hongdae[1], res=10)
dist = h3.h3_distance(gangnam_h3, hongdae_h3)

print('gangnam_h3:', gangnam_h3)
print('hongdae_h3:', hongdae_h3)
print('distance  :', dist)
gangnam_h3: 8a30e1ca390ffff
hongdae_h3: 8a30e1d84797fff
distance : 126만약 서로 resolution이 다를시 -1을 리턴시킵니다.
gangnam_h3 = h3.geo_to_h3(gangnam[0], gangnam[1], res=8)
hongdae_h3 = h3.geo_to_h3(hongdae[0], hongdae[1], res=7)
dist = h3.h3_distance(gangnam_h3, hongdae_h3)

print('gangnam_h3:', gangnam_h3)
print('hongdae_h3:', hongdae_h3)
print('distance  :', dist)
gangnam_h3: 8830e1ca39fffff
hongdae_h3: 8730e1d84ffffff
distance : -1Resolution 알아내기
gangnam = [37.508811, 127.040978]
hongdae = [37.557435, 126.925808]
gangnam_h3 = h3.geo_to_h3(gangnam[0], gangnam[1], res=8)

res = h3.h3_get_resolution(gangnam_h3)
print('강남 resolution:', res)
강남 resolution: 8Shapely 사용
from shapely.geometry import Point, Polygon

locations = h3.h3_to_geo_boundary(h3_loc)
display(locations)
Polygon(locations)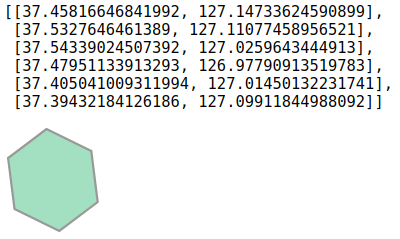
Neighbors인지 체크
h3_indexes_are_neighbors 함수를 통해서 neighbor인지 아닌지를 판단 할 수 있습니다.
gangnam = [37.508811, 127.040978]
hongdae = [37.557435, 126.925808]
gangnam_h3 = h3.geo_to_h3(gangnam[0], gangnam[1], res=10)
hongdae_h3 = h3.geo_to_h3(hongdae[0], hongdae[1], res=10)
is_neighbor = h3.h3_indexes_are_neighbors(gangnam_h3, hongdae_h3)

print('강남 - 홍대:', is_neighbor)
강남 - 홍대: FalseNeighbors 꺼내기
neighbors 를 꺼내기 위해서는 k_ring 함수를 사용합니다.
gangnam = [37.508811, 127.040978]
gangnam_h3 = h3.geo_to_h3(gangnam[0], gangnam[1], res=7)
neighbors = h3.k_ring(gangnam_h3, ring_size=2)
display(neighbors)

rand_h3 = np.random.choice(list(neighbors))
is_neighbor = h3.h3_indexes_are_neighbors(gangnam_h3, rand_h3)

print('강남 H3   :', gangnam_h3)
print('랜덤 H3   :', rand_h3)
print('강남 - 랜덤:', is_neighbor){'8730e1c12ffffff',
'8730e1c80ffffff',
'8730e1c81ffffff',
...
'8730e1cb1ffffff',
'8730e1cb5ffffff'}
강남 H3 : 8730e1ca3ffffff
랜덤 H3 : 8730e1c85ffffff
강남 - 랜덤: Truedef to_polygon(l):
return Polygon(h3.h3_to_geo_boundary(l, geo_json=True))
df = gpd.GeoDataFrame({'h3': list(neighbors)})
df['geometry'] = df['h3'].apply(to_polygon)
df.crs = {'init': 'epsg:4326'}
display(df.head())
m = folium.Map(gangnam, zoom_start=12)
folium.GeoJson(df).add_to(m)
for _h3 in neighbors:
loc = h3.h3_to_geo(_h3)
folium.Marker(loc).add_to(m)
m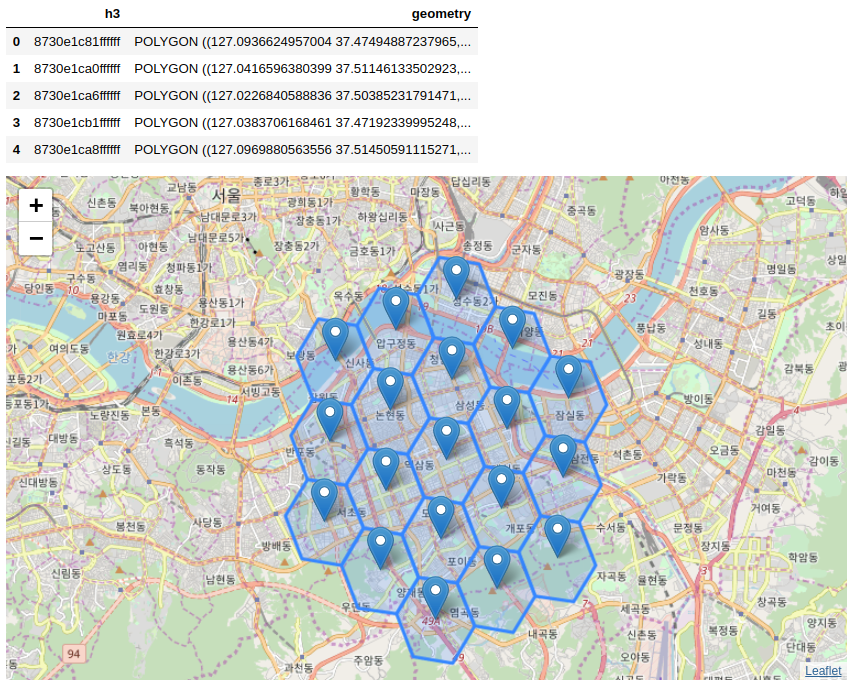
Validation of H3
gangnam = [37.508811, 127.040978]
gangnam_h3 = h3.geo_to_h3(gangnam[0], gangnam[1], res=10)

print(f'강남    ({gangnam_h3}):', h3.h3_is_valid(gangnam_h3))
print('이상한데 (8a30e1ca390afff):', h3.h3_is_valid('8a30e1ca390afff'))
강남 (8a30e1ca390ffff): True
이상한데 (8a30e1ca390afff): FalseChildren 가져오기
gangnam = [37.508811, 127.040978]
gangnam_h3 = h3.geo_to_h3(gangnam[0], gangnam[1], res=9)

children_h3 = h3.h3_to_children(gangnam_h3, 11)
print(children_h3){'8b30e1ca3900fff',
'8b30e1ca3901fff',
'8b30e1ca3902fff',
...
'8b30e1ca3935fff',
'8b30e1ca3936fff'}def to_polygon(l):
return Polygon(h3.h3_to_geo_boundary(l, geo_json=True))
children_h3 = children_h3 | set([gangnam_h3])
df = gpd.GeoDataFrame({'h3': list(children_h3)})
df['geometry'] = df['h3'].apply(to_polygon)
df.crs = {'init': 'epsg:4326'}
display(df.head())
m = folium.Map(gangnam, zoom_start=17)
folium.GeoJson(df).add_to(m)
for _h3 in children_h3:
loc = h3.h3_to_geo(_h3)
folium.Marker(loc).add_to(m)
m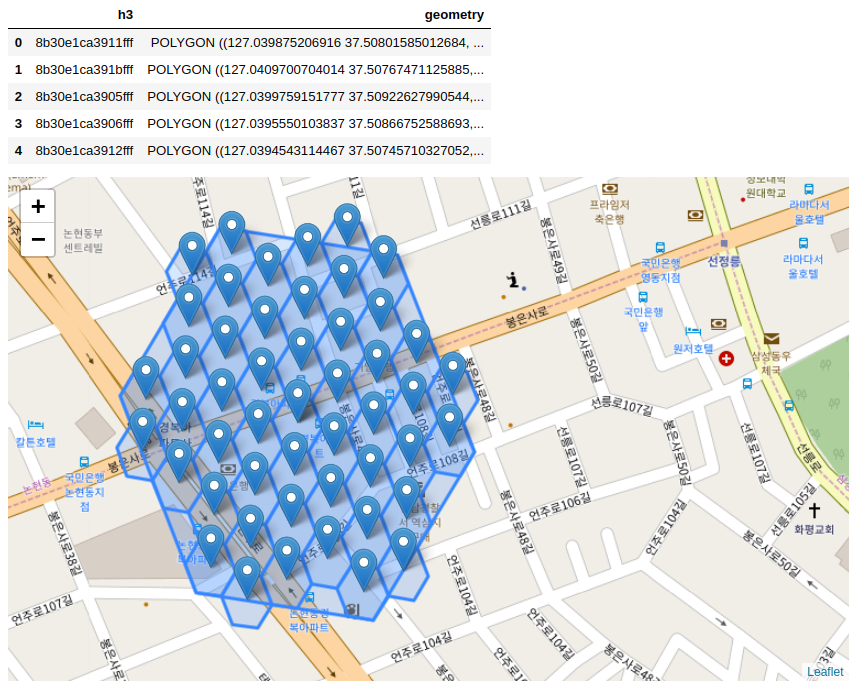
Parent 가져오기
gangnam = [37.508811, 127.040978]
gangnam_h3 = h3.geo_to_h3(gangnam[0], gangnam[1], res=10)

parent_h3 = h3.h3_to_parent(gangnam_h3, 9)
display(parent_h3)'8930e1ca393ffff'def to_polygon(l):
return Polygon(h3.h3_to_geo_boundary(l, geo_json=True))
group_h3 = set([parent_h3]) | set([gangnam_h3])
df = gpd.GeoDataFrame({'h3': list(group_h3)})
df['geometry'] = df['h3'].apply(to_polygon)
df.crs = {'init': 'epsg:4326'}
display(df.head())
m = folium.Map(gangnam, zoom_start=17)
folium.GeoJson(df).add_to(m)
for _h3 in group_h3:
loc = h3.h3_to_geo(_h3)
folium.Marker(loc).add_to(m)
m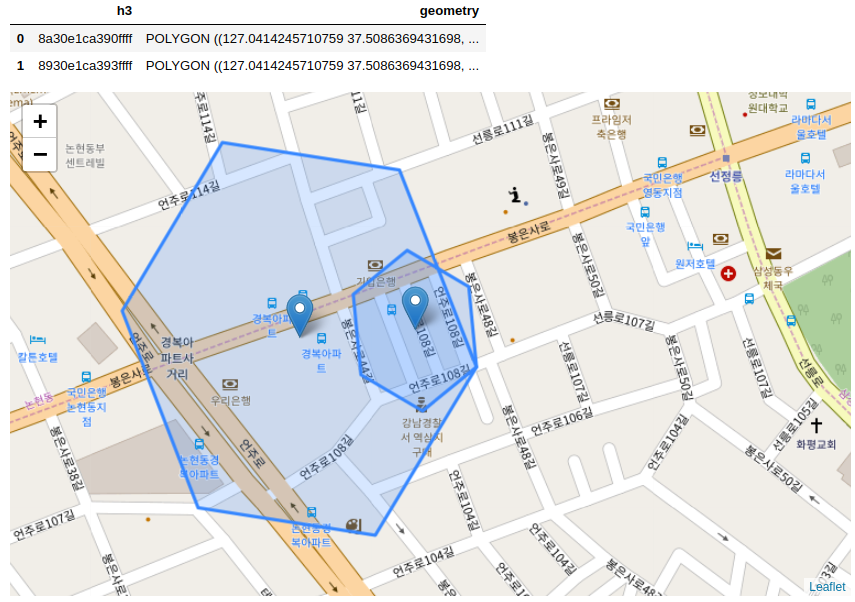
Boundary 좌표 가져오기
gangnam = [37.508811, 127.040978]
gangnam_h3 = h3.geo_to_h3(gangnam[0], gangnam[1], res=10)

h3.h3_to_geo_boundary(gangnam_h3)[[37.508636943169805, 127.04142457107591],
[37.509257655295244, 127.04135141952166],
[37.50953683612771, 127.040750604166],
[37.50919530577431, 127.04022295221114],
[37.508574600888544, 127.04029611275315],
[37.50829541911647, 127.04089691626244]]Custom Style Function
gangnam = [37.508811, 127.040978]
gangnam_h3 = h3.geo_to_h3(gangnam[0], gangnam[1], res=7)
neighbors = h3.k_ring(gangnam_h3, ring_size=2)
display(neighbors)reinforcement-learning{'8730e1c12ffffff',
'8730e1c80ffffff',
...
'8730e1cb5ffffff'}def to_polygon(l):
return Polygon(h3.h3_to_geo_boundary(l, geo_json=True))
def my_style_function(feature):
label = feature['properties']['value']
color = cm.step.Set1_09.scale(0, n)(label)
return dict(fillColor=color,
color='black',
weight=1.2,
fillOpacity=0.7)
n = len(neighbors)
df = gpd.GeoDataFrame({'h3': list(neighbors),
'value': np.random.randint(0, n, size=n)})
df['geometry'] = df['h3'].apply(to_polygon)
df.crs = {'init': 'epsg:4326'}
display(df.head())
m = folium.Map(gangnam, zoom_start=12)
folium.GeoJson(df, style_function=my_style_function).add_to(m)
for _h3 in neighbors:
loc = h3.h3_to_geo(_h3)
folium.Marker(loc).add_to(m)
m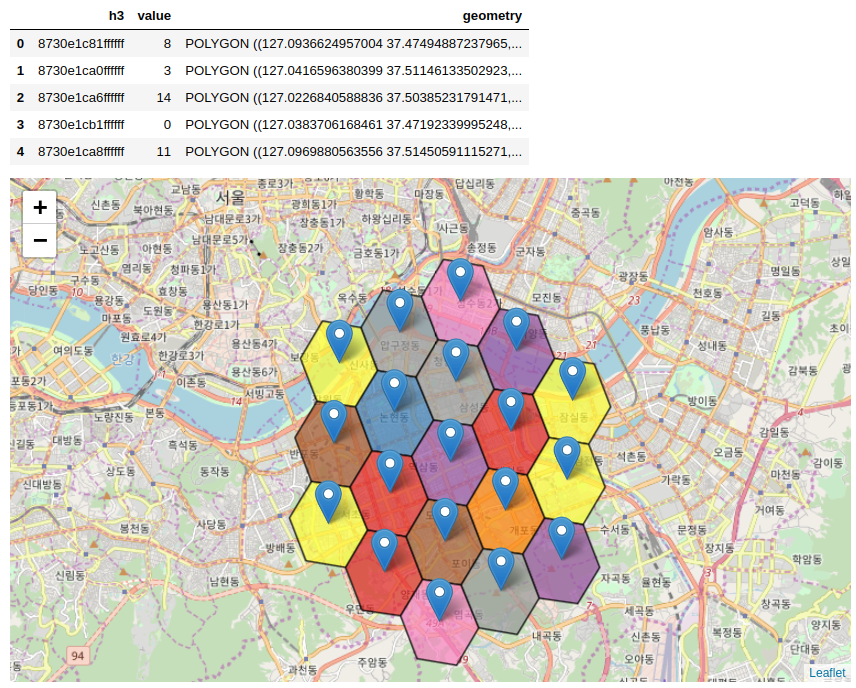
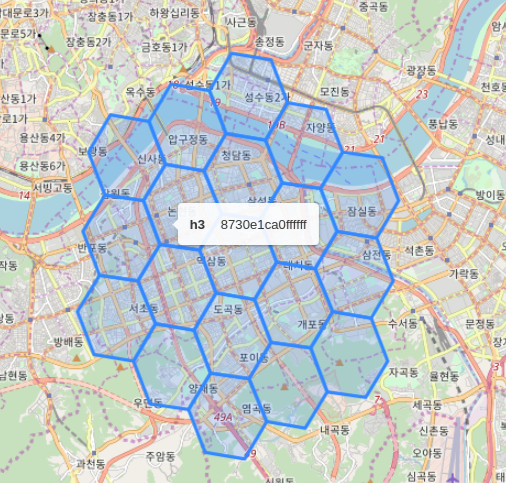
Tooltip
tootip = folium.GeoJsonTooltip(fields=['h3']) 사용해서 tooltip을 만들수 있습니다.
Tooltip은 mouseover 시에 나타납니다.
gangnam = [37.508811, 127.040978]
gangnam_h3 = h3.geo_to_h3(gangnam[0], gangnam[1], res=7)
neighbors = h3.k_ring(gangnam_h3, ring_size=2)
display(neighbors)
def to_polygon(l):
return Polygon(h3.h3_to_geo_boundary(l, geo_json=True))
n = len(neighbors)
df = gpd.GeoDataFrame({'h3': list(neighbors),
'value': np.random.randint(0, n, size=n)})
df['geometry'] = df['h3'].apply(to_polygon)
df.crs = {'init': 'epsg:4326'}
display(df.head())
m = folium.Map(gangnam, zoom_start=12)
tootip = folium.GeoJsonTooltip(fields=['h3'])
folium.GeoJson(df, tooltip=tootip).add_to(m)
m