Financial Data Processing - BAR
1. BARS
1.1 Inroduction
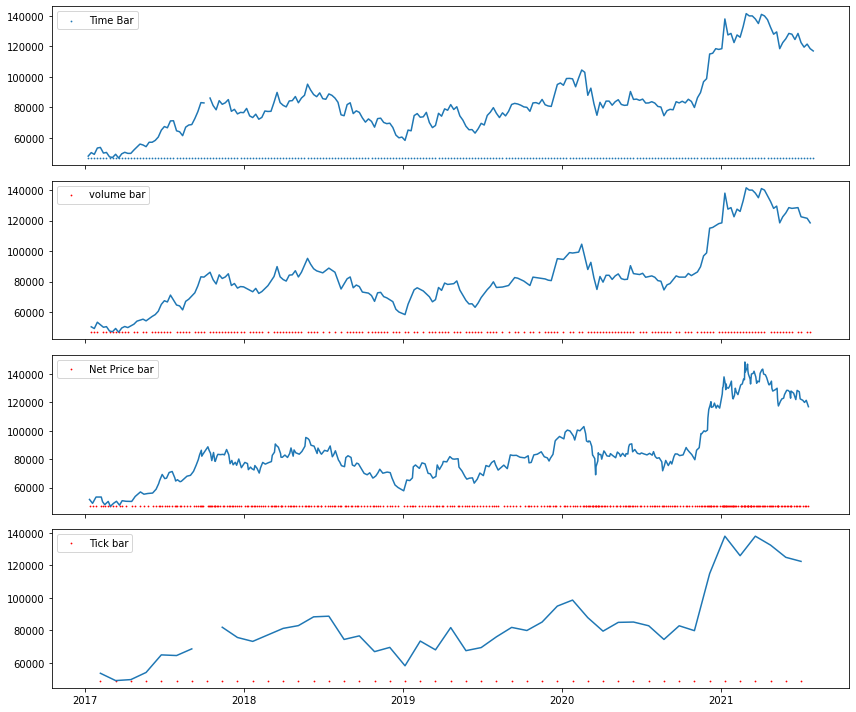
- Time Bar
- 일반적인 시가, 고가, 저가, 종가, 볼륨 데이터를 의미
- 문제점은 시간에 따라서 다른 패턴을 보입니다. 예를 들어 장시작후 10분이 오후 12시쯤의 거래와 비교하면 훨씬 액티브 합니다.
- 즉 low activity period 에는 oversampling이 되고, high-activity period 에는 undersampling이 됩니다.
- Tick Bar
- 단순 거래횟수를 기준으로 삼는 것
- Trading Activity를 판단할 수 있다
- 단점은 100개의 주식을 사도 -> 하나의 거래로 처리 되기 때문에 Volume에 대한 정보 손실이 있다
- Volume Bar
- Tick Bar의 단점을 보완한다
- X축이 일정양의 Volume을 의미한다
- Dollar Bar
- 같은 1000만원이더라도 주가에 따라서 수량이 크게 차이가 날수 있다.
- Dollar Bar는 이러한 문제를 해결한다
사실.. Time Bar의 진짜 문제점은.. 헤지펀드사의 Fake 데이터입니다.
일반적인 retail trader가 대부분 어떤 알고리즘으로 짜여져 있는지 알고 있으며,
가짜 주문, 가짜 volume을 만들어내서 RSI 또는 Bollinger Bands를 속입니다.
1.2 Data
df = pickle.load(open('../Data/000660.pkl', 'rb'))
df = df[df.index >= '2017-01-01']

# 보기 편하게 resample 함
OHLCV_AGG = OrderedDict((
    ('Open', 'first'),
    ('High', 'max'),
    ('Low', 'min'),
    ('Close', 'last'),
    ('Volume', 'sum'),
    ('NetPrice', 'sum')
))
week_df = df.resample('W').agg(OHLCV_AGG)
display(week_df.tail())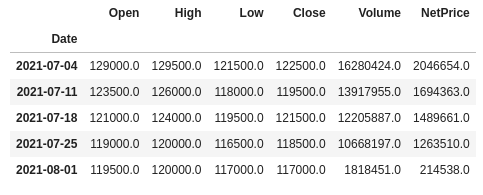
1.3 Volume Bar (Pandas 구현)
Pandas로 구현하는 방법은 사실 좀 부정확하다.
GroupBy해서 하는 방법인데.. 맞지가 않다
다만 참고사항으로 넣어둠
def bar(x, n):
    return np.int64(x / n)

VOLUME_OHLCV_AGG = OrderedDict((
    ('Open', 'first'),
    ('High', 'max'),
    ('Low', 'min'),
    ('Close', 'last'),
    ('Volume', 'sum'),
    ('NetPrice', 'sum'),
    ('Date', 'last')
))

volume_df = (week_df
             .reset_index()
             .groupby(bar(week_df.Volume.cumsum(), 20000000))
             .agg(VOLUME_OHLCV_AGG))
volume_df.index.name = 'VolumeBar'
volume_df.reset_index(inplace=True)
volume_df.set_index('Date', inplace=True)

print(volume_df.shape)
volume_df.tail()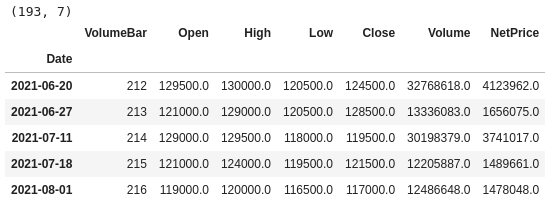
1.4 Volume Bar (Python 구현)
def build_bar(df_:pd.DataFrame, colume:str, size:int):
    _sum = 0
    data = []
    for i, row in df_.iterrows():
        _sum += row[colume]
        if _sum >= size:
            data.append(row)
            _sum = 0
    return pd.DataFrame(data)

volume_df = build_bar(week_df, 'Volume', 20000000)
volume_df.tail()
1.5 Tick Bar
원래 Intraday 거래 기준으로 하면, 장시작후 시간, 오후, 장마감 때의 tick의 분포가 달라지기 나타나는데..
현재 사용한 데이터는 weekly기준이기 때문에 기존 Time Bar와 별 차이가 없게 느껴질수 있다.
week_df['tick'] = 1
tick_df = build_bar(week_df, 'tick', 5)
print(tick_df.shape)
tick_df.tail()
1.6 Price Bar
price_df = build_bar(df, 'NetPrice', 1000000)
price_df.tail()
1.7 Visualization