AUC & PRAUC Threshold Optimization
Basic 101
Confusion Matrix
| Name | Short | Formular | Another Formula |
|---|---|---|---|
| Sensitivity, Recall, True Positive Rate | TPR (Recall) | TPR = TP / (TP + FN) | 1 - FNR |
| Specificity, True Negative Rate | TNR | TN / (TN + FP) | 1 - FPR |
| Precision, Positive Predictive Value | PPV (Precision) | TP / (TP + FP) | 1 - FDR |
| Fallout, False Positive Rate | FPR (Fallout) | FP / (FP + TN) | 1 - TNR |
| False Discovery Rate | FDR | FP / (FP + TP) | 1 - PPV |
How to choose the threshold
문제에 따라서 정하는게 틀려 질 수 있습니다.
무조건 TRP 그리고 FPR 을 최대치로 하는 방향으로 갖을 필요는 없습니다. (즉 비즈니스 요구 사항에 따라서 달라질 수도 있습니다.)
하지만 보통의 경우는 AUC 를 가장 크게 가져가는 threshold 를 찾는게 보통입니다.
예를 들어서 범죄자를 찾는다고 했을때, 더 낮은 FPR 을 설정하면서, 적절한 수준의 TRP을 사람의 의해서 정해질 수 도 있습니다.
따로 비즈니스적인 요구사항이 없다면 아래의 공식을 따르면 됩니다.
Youden’s J static Optimal Threshold
보통의 경우는 다음과 같은 공식을 따릅니다.
Youden’s J statistic 에 따르면
그냥 TPR - FPR 하면 됩니다.
Geometric Mean
G-Mean (Geometric Mean 을 사용하는 경우 Sensitivity - Specificity 를 합니다.
누군가는 Imbalanced Data 에서 성능이 좋다고 하는데..
제 실험 결과에서는 그닥 좋지 않습니다.
F-Measure (For Imbalanced Dataset)
Imbalanced Data 에서 threshold 를 찾을때 F-Measure (F1-Score 와 동일한거) 를 주로 사용합니다.
\[F-Measure = 2 \times \frac{Precision \times Recall}{ Precision + Recall}\]Recall + Precision (For Imbalanced Dataset)
요것도 어느정도는 괜찮게 나왔습니다.
사실 책에 있는 방법은 아니고.. 그냥 실험을 해봤는데, ACC 자체에 있어서는 F-Measure 보다는 좋았습니다.
하지만 당연히 F1-Score 로 따지면 좀 떨어지고요.
회사에서 한번 적용해 보는 것도 좋을듯 하네요.
Python Code
Preparation
별개로 plt.style.use('ggplot') 괜찮습니다
%config Completer.use_jedi = False

import numpy as np
import pandas as pd
from matplotlib import pylab as plt
from sklearn.datasets import make_classification
from sklearn.model_selection import train_test_split

plt.style.use("ggplot")
Data
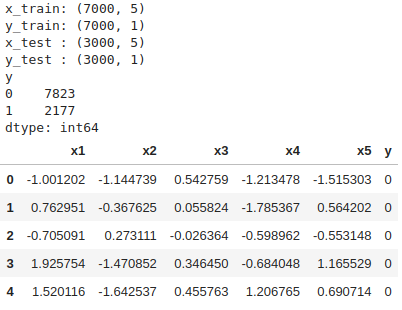
x_data, y_data = make_classification(
    n_samples=10000, n_features=5, n_classes=2, weights=(0.8, 0.2), flip_y=0.05, random_state=1
)

x_data = pd.DataFrame(x_data, columns=["x1", "x2", "x3", "x4", "x5"])
y_data = pd.DataFrame(y_data.reshape(-1, 1), columns=["y"])
x_train, x_test, y_train, y_test = train_test_split(
    x_data, y_data, test_size=0.3, random_state=2
)

# Display Data
print("x_train:", x_train.shape)
print("y_train:", y_train.shape)
print("x_test :", x_test.shape)
print("y_test :", y_test.shape)
display(y_data.value_counts())
display(x_data.join(y_data).head())
Logistic Regression Model
from sklearn.linear_model import LogisticRegression

model = LogisticRegression(solver="lbfgs")
model.fit(x_train, y_train.values.reshape(-1))

y_prob = model.predict_proba(x_test)[:, 1]
ROC AUC & Optimal Threshold
from sklearn.metrics import (
RocCurveDisplay,
accuracy_score,
auc,
f1_score,
precision_score,
recall_score,
roc_auc_score,
roc_curve,
)
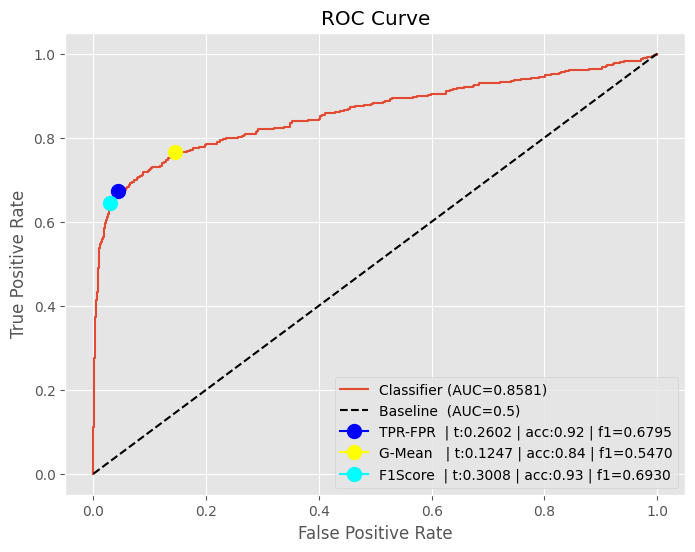
def calculate_roc(y_true, y_prob, plot, label, method=None):
fpr, tpr, thresholds = roc_curve(y_true, y_prob)
# TPR - FPR Optimal Threshold
if method == 'gmean':
gmeans = np.sqrt(tpr * (1 - fpr))
max_idx = np.argmax(gmeans)
max_threshold = thresholds[max_idx]
elif method == 'diff':
max_idx = np.argmax(tpr - fpr)
max_threshold = thresholds[max_idx]
else:
max_idx = np.argmax(tpr - fpr)
max_threshold = thresholds[max_idx]
# Other Metrics at the max_threshold
auc_ = auc(fpr, tpr)
acc_ = accuracy_score(y_true, y_prob >= max_threshold)
f1_ = f1_score(y_true, y_prob >= max_threshold)
plot.plot(fpr, tpr, label=f"{label} | auc:{auc_:.4f})")
plot.plot(fpr[max_idx], tpr[max_idx], marker="o", markersize=10,
label=f'{label} | max_threshold: {max_threshold}')
print(f'{label} | max_threshold: {max_threshold}')
fig, plot = plt.subplots(1, figsize=(8, 6))
calculate_roc(y_test, y_prob, plot, 'Logistic Regression')
plot.plot([0, 1], [0, 1], "k--", label=f"Baseline | auc:0.5")
plot.set_xlabel("False Positive Rate")
plot.set_ylabel("True Positive Rate")
plot.set_title(f"ROC Curve")
plot.legend(loc="lower right")
PRAUC Optimal Threshold
기본적으로 Precision Recall Curve 는 오직 positive 에서의 성능을 주요한 결정 요소로 바라봅니다.
따라서 imbalanced data 의 경우는 PRAUC Curve 를 사용하는게 모델 평가에 더 적절합니다.
예를 들어서 0:90% 그리고 1:10% 클래스인 상황에서, 모델이 전부다 0이라고 하면, Accuracy는 90%가 됩니다.
PRAUC 는 precision, recall둘다 바라보며, 특히 precision은 모델이 positive라고 예측한 것들 중에서
positive를 얼마나 잘 맞췄는지 보기 때문에 class 1 에대한 평가를 잘 할 수 있습니다.
Recall 값이 작은 상황에서도, 높은 precision을 보인다면, 모델은 positive class 에 대해서 잘 분류한다는 것을 볼 수 있습니다.
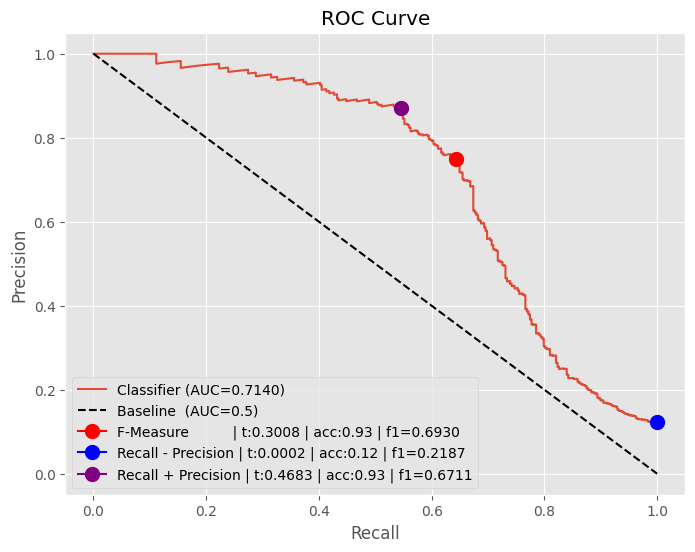
코드 설명을 좀 하면..
- F1-score 그리고 F-Measure 는 공식은 동일합니다. (그런데 살짝 서로 다르네요)
- 결과적으로 F-Measure만 사용해도 괜찮을듯 합니다.
- ARGMAX(Recall - Precision) 방식은 안 좋습니다. (이런 방식은 없습니다. 한번 해봤어요)
- ARGMAX(Recall + Precision) 또한 F1-Score 입장에서 보면.. 그닥 좋지 않습니다. 하지만 ACC 자체에서는 가장 높네요.
from sklearn.metrics import auc, precision_recall_curve

def calculate_prauc(y_true, y_prob, plot, label, method=[]):
    from collections.abc import Iterable

    def point_optimal_threshold(name):

        # Other Metrics at the max_threshold

        acc_ = accuracy_score(y_true, y_prob >= max_threshold)
        f1_ = f1_score(y_test, y_prob >= max_threshold)

        plot.plot(recall[max_idx], precision[max_idx], marker="o", markersize=10,
              label=f'{label} | {name:5} | optimal threshold: {max_threshold}')


    if not isinstance(method, Iterable):
        method = [method]

    precision, recall, thresholds = precision_recall_curve(y_true, y_prob)
    auc_ = auc(recall, precision)
    plot.plot(recall, precision, label=f"{label} | auc:{auc_:.4f})")

    # Optimize the thesholds
    if 'diff' in method:
        print('aa')
        max_idx = np.argmax(recall - precision)
        max_threshold = thresholds[max_idx]
        point_optimal_threshold('diff')

    if 'plus' in method :
        max_idx = np.argmax(recall + precision)
        max_threshold = thresholds[max_idx]
        point_optimal_threshold('plus')

    if 'f1' in method:
        fscores = 2 * (precision * recall) / (precision + recall)
        max_idx = np.argmax(fscores)
        max_threshold = thresholds[max_idx]
        point_optimal_threshold('f1')


fig, plot = plt.subplots(1, figsize=(10, 8))
calculate_prauc(y_test, y_prob, plot, 'Logistic Regression', method=('diff', 'plus', 'f1'))


plot.plot([0, 1], [1, 0], "k--", label=f"Baseline  (AUC=0.5)")
plot.set_xlabel("Recall")
plot.set_ylabel("Precision")
plot.set_title(f"Precision Recall Curve")
plot.legend(loc="lower left")
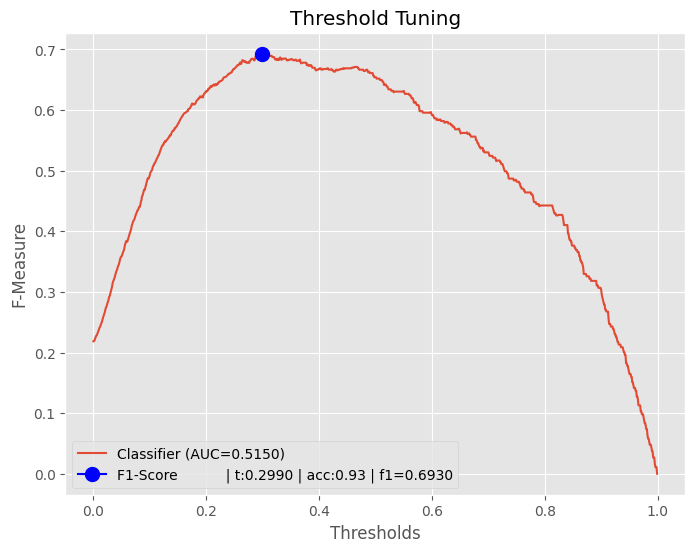
Threshold Tuning
그냥 모델 하나 있고.. 뭐가 best threshold 인지 빠르게? 찾으려고 할때.. 다음의 방식을 사용할수 있으며..
그냥 computation 이 많이 들어가긴 하는데.. 뭐.. 그닥 차이가..
방식은 그냥 thresholds 리스트 만들어 놓고.. 하나하나 다 F1-Score 매기는 것 입니다.
좀 무식하긴 해도 잘 되요.
from sklearn.metrics import accuracy_score, auc, f1_score, precision_recall_curve

def calculate_threshold_tuning(y_true, y_prob, plot, label):
    thresholds = np.arange(0, 1, 0.001)
    scores = [f1_score(y_true, y_prob >= t) for t in thresholds]
    max_idx = np.argmax(scores)
    max_threshold = thresholds[max_idx]

    # Main line
    auc_ = auc(thresholds, scores)
    plot.plot(thresholds, scores, label=f"{label} | auc:{auc_:.4f}")

    # Other metrics
    acc_ = accuracy_score(y_true, y_prob >= max_threshold)
    f1_ = f1_score(y_true, y_prob >= max_threshold)
    optimal_msg = f"{label:18} | acc:{acc_:.2f} | f1={f1_:.4f}"
    plt.plot(thresholds[max_idx], scores[max_idx], marker="o", markersize=10,
             label=f'{optimal_msg}')


fig, plot = plt.subplots(1, figsize=(10, 8))
calculate_threshold_tuning(y_test, y_prob, plot, 'Logistic Regression')

plot.set_title(f"Threshold Tuning")
plot.set_xlabel("Thresholds")
plot.set_ylabel("F-Measure")
plot.legend(loc="lower left")
특정 Threshold 에서의 AUC
정확하게 이런 방법은 ML책에 나오는 방법은 아닙니다.
그래서 이런 지표에 대한 이름도 딱히 없습니다.
지난번 Baysian 공식을 엮으로 엮어서 casuality analysis 한것 처럼 우린 그냥 수식을 이용해서 문제를 해결할 뿐입니다.
특정 threshold 를 걸어주게되면, 이미 특정 threshold 기준으로 probability가 고정이 됩니다.
이 기준을 해당 기준을 갖고서 AUC를 구했을때의 지표입니다.
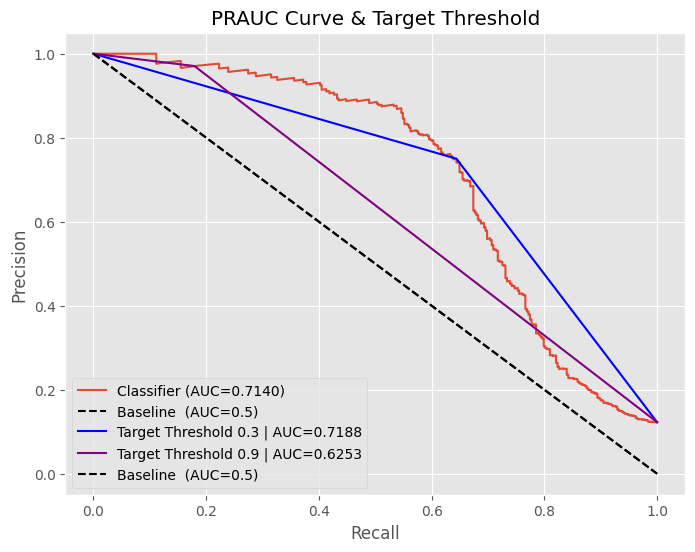
예제는 다음과 같습니다.
- target_threshold=0.3 : 해당 0.3 PRAUC 에서 F1-Score의 optimal threshold 입니다.
- target_threshold=0.9 : 그냥 임의로 정한 값입니다. (비교를 위해서)
0.3 threshold의 경우는 AUC 0.7140이 나옵니다.
0.9 threshold의 경우는 AUC 0.6253이 나옵니다.
이런 방식을 사용해서 모델간의 성능을 비교하기도 합니다.
다만.. 위에서 이야기 했듯이 공식적으로 있는 건 아니기 때문에 뭐라고 해야 할지 모르겠네요.
precision, recall, thresholds = precision_recall_curve(y_test, y_prob)

# F-Measure (F1-Score)
fscores = 2 * (precision * recall) / (precision + recall)
idx1 = np.argmax(fscores)


# Plot
roc_auc = auc(recall, precision)
fig, plot = plt.subplots(1, figsize=(8, 6))
plot.plot(recall, precision, label=f"Classifier (AUC={roc_auc:.4f})")
plot.plot([0, 1], [1, 0], "k--", label=f"Baseline  (AUC=0.5)")


# Threshold 0.3 에서의 AUC
target_threshold = 0.3
precision, recall, thresholds = precision_recall_curve(y_test, y_prob >= target_threshold)
plot.plot(recall, precision, color='blue', label=f"Target Threshold {target_threshold} | AUC={auc(recall, precision):.4f}")

# Threshold 0.9 에서의 AUC
target_threshold = 0.9
precision, recall, thresholds = precision_recall_curve(y_test, y_prob >= target_threshold)
plot.plot(recall, precision, color='purple', label=f"Target Threshold {target_threshold} | AUC={auc(recall, precision):.4f}")


plot.plot([0, 1], [1, 0], "k--", label=f"Baseline  (AUC=0.5)")

plot.set_xlabel("Recall")
plot.set_ylabel("Precision")
plot.set_title(f"PRAUC Curve & Target Threshold")
plot.legend(loc="lower left")