GeoHash, GeoPandas and Folium
Introduction
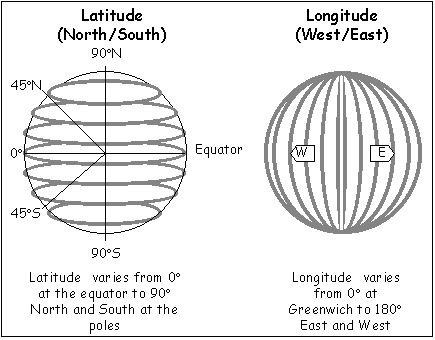
Latitude and Longitude
Latitude는 y축으로 생각하면 되고, 가장 최극단에 북극점, 남극점이 존재합니다.
이론상 가장 남쪽은 -90이 나오고, 지구의 중간(equator 적도)은 0, 그리고 가장 북쪽은 90까지 나올수 있습니다.
Longitude는 x축으로 생각하면 되고, 영국 그리니치 천문대가 대략 0에서 시작해서, 지도상 오른쪽으로 갈수록 longitude의 값을 올라갑니다. 그리니치 천문대를 중심으로 왼쪽으로 가면 음수가 잡히고, 오른쪽으로 가면 양수가 잡힙니다.
- Latitude range: -90 to 90
- Longitude range: -180 to 180
GeoHash Legnth
| GeoHash Length | Area Width | Area Height |
|---|---|---|
| 1 | 5,009.4km | 4,992.6km |
| 2 | 1,252.3km | 624.1km |
| 3 | 156.5km | 156km |
| 4 | 39.1km | 19.5km |
| 5 | 4.9km | 4.9km |
| 6 | 1.2km | 609.4m |
| 7 | 152.9m | 152.4m |
| 8 | 38.2m | 19m |
| 9 | 4.8m | 4.8m |
| 10 | 1.2m | 59.5cm |
| 11 | 14.9cm | 14.9cm |
| 12 | 3.7cm | 1.9cm |
GeoJSON
예를 들어 아래와 같은 형태를 갖습니다.
Python에서는 두가지 방법이 있는데, GeoJSON형태를 만들어서 사용하든지 또는 GeoPandas를 사용합니다.
{
    "type": "FeatureCollection",
    "features": [
        {
            "properties": {"name": "Alabama"},
            "id": "AL",
            "type": "Feature",
            "geometry": {
                "type": "Polygon",
                "coordinates": [[[-87.359296, 35.00118], ...]]
                }
            },
        {
            "properties": {"name": "Alaska"},
            "id": "AK",
            "type": "Feature",
            "geometry": {
                "type": "MultiPolygon",
                "coordinates": [[[[-131.602021, 55.117982], ... ]]]
                }
            },
        ...
        ]
    }
GeoHash Library Getting Started
Converting
Latitude 그리고 Longitude를 알고 있다면 geohash.encode(lat, lng, precision) 을 사용해서 geohash로 변환 가능 합니다.
반대로 geohash.decode() 함수를 사용해서 해당 geohash의 latitude 그리고 longitude를 알아낼 수 있습니다.
import geohash

lat, lng = (37.497868971527424, 127.0276489936216) # 강남 Lat, Lng
gangnam = geohash.encode(lat, lng, 5)
decoded_location = geohash.decode(gangnam)  # gangnam = 'wydm6'

print('Lat, Lng        :', lat, lng)
print('강남 geohash     :', gangnam)
print('Decoded Location:', *decoded_location)
Lat, Lng : 37.497868971527424 127.0276489936216
강남 geohash : wydm6
Decoded Location: 37.50732421875 127.02392578125decode_exactly function
더 자세한 정보가 필요시 decode_exactly 함수를 사용합니다.
이때 return값은 (latitude, longitude, latitude error margin, longitude error margin) 입니다
geohash.decode_exactly('wydm6')(37.50732421875, 127.02392578125, 0.02197265625, 0.02197265625)Neighbors
GeoHash의 주변을 검색할 수 있습니다.
geohash.neighbors(gangnam)['wydm3', 'wydm7', 'wydm4', 'wydm1', 'wydm5', 'wydmd', 'wydm9', 'wydme']Visualization with Folium
Choropleth
geo_data 와 data 두개를 연결시켜줘야 합니다.
geo_data에는 geometry 정보가 있어서 여기서 polygon인지 point인지 위치 정보가 들어 있습니다.
데이터에는 지도상에 색상으로 정보를 보여주기 위한 어떤 값이 존재하게 됩니다.
두개의 데이터를 연결시키기 위해서 SQL의 join처럼 어떤 값을 기준으로 위치 정보와 값이 연결이 되게 되는데 key_on 값에서 설정하게 됩니다.
아래 GeoPandas DataFrame의 에서 geohash를 key_on값으로 사용했습니다.
당연히 data로 사용되는 데이터에도 join으로 사용할 geohash column이 존재해야 합니다.
key_on=’feature.properties.geohash’ 이렇게 사용한 이유는 Pandas DataFrame을 json으로 바꾸면.. GeoJson으로 변환이 됩니다.
보면 feature 안에 properties 안에 geohash가 존재하는것을 볼 수 있습니다.
이 값을 사용한다는 뜻으로 feature.properties.geohash를 명시하였습니다.
import folium
from polygon_geohasher.polygon_geohasher import geohash_to_polygon

locations = [(37.49786897152, 127.02764899362),
             (37.50732421875, 126.97998046875),
             (37.50732421875, 127.06787109375),
             (37.46337890625, 127.02392578125),
             (37.46337890625, 126.97998046875),
             (37.46337890625, 127.06787109375),
             (37.55126953125, 127.02392578125),
             (37.55126953125, 126.97998046875),
             (37.55126953125, 127.06787109375)]

# Create Geo Pandas DataFrame
df = gpd.GeoDataFrame({'location':locations, 'value': np.random.rand(9)})
df['geohash'] = df['location'].apply(lambda l: geohash.encode(l[0], l[1], 5))
df['geometry'] = df['geohash'].apply(geohash_to_polygon)
df.crs = {'init': 'epsg:4326'}


print('features.properties.geohash <- 요걸로 매핑함')
display(json.loads(df.to_json())['features'][0])
display(df.head())
features.properties.geohash <- 요걸로 매핑함
{'id': '0',
'type': 'Feature',
'properties': {'location': [37.49786897152, 127.02764899362],
'value': 0.14382200834259584,
'geohash': 'wydm6'},
'geometry': {'type': 'Polygon',
'coordinates': [[[127.001953125, 37.4853515625],
[127.0458984375, 37.4853515625],
[127.0458984375, 37.529296875],
[127.001953125, 37.529296875],
[127.001953125, 37.4853515625]]]}}
location value geohash geometry
--------------------------------------------------------------------------------------------------------
0 (37.49786897152, 127.02764899362) 0.143822 wydm6 POLYGON ((127.001953125 37.4853515625, 127.045...
1 (37.50732421875, 126.97998046875) 0.183472 wydm3 POLYGON ((126.9580078125 37.4853515625, 127.00...
2 (37.50732421875, 127.06787109375) 0.654764 wydm7 POLYGON ((127.0458984375 37.4853515625, 127.08...
3 (37.46337890625, 127.02392578125) 0.076692 wydm4 POLYGON ((127.001953125 37.44140625, 127.04589...
4 (37.46337890625, 126.97998046875) 0.274943 wydm1 POLYGON ((126.9580078125 37.44140625, 127.0019...lat, lng = (37.497868971527424, 127.0276489936216) # 강남 Lat, Lng
m = folium.Map((lat, lng), zoom_start=12)
folium.Choropleth(geo_data=df,
name='choropleth',
data=df,
columns=['geohash', 'value'],
key_on='feature.properties.geohash',
fill_color='YlGn',
fill_opacity=0.7,
line_opacity=0.2,
legend_name='asdf').add_to(m)
m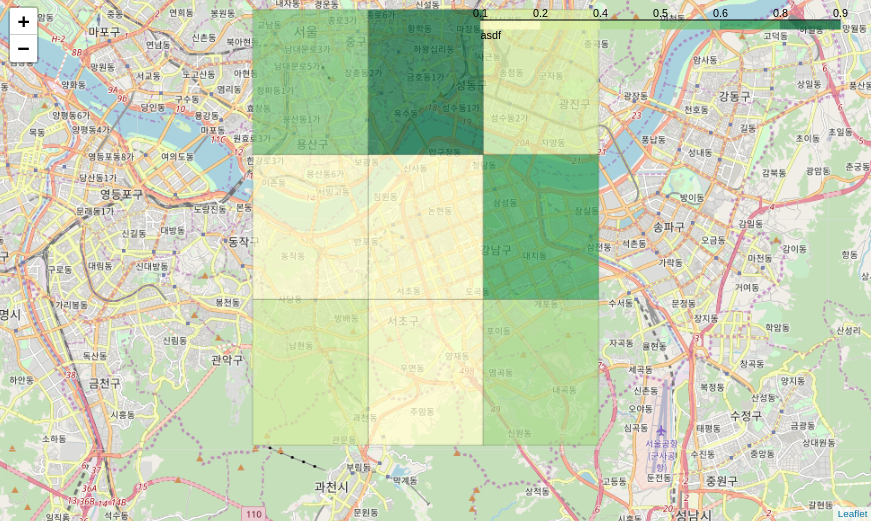
GeoJson
원래는 GeoJSON object(python dictionary)가 들어가야 하는데, 그냥 GeoPandas의 GeoDataFrame넣어도 돌아갑니다.
Choropleth 에서는 안되는 style_function을 통해서 마음대로 스타일링이 가능합니다.
def my_style_function(feature):
    label = feature['properties']['kmean_label']
    color = cm.step.Set1_09.scale(0, 9)(label)

    return dict(fillColor=color,
                color='black',
                weight=1.2,
                fillOpacity=0.7)

df['kmean_label'] = np.arange(9)

lat, lng = (37.497868971527424, 127.0276489936216) # 강남 Lat, Lng
m = folium.Map((lat, lng), zoom_start=12)
folium.GeoJson(df, style_function=my_style_function).add_to(m)
m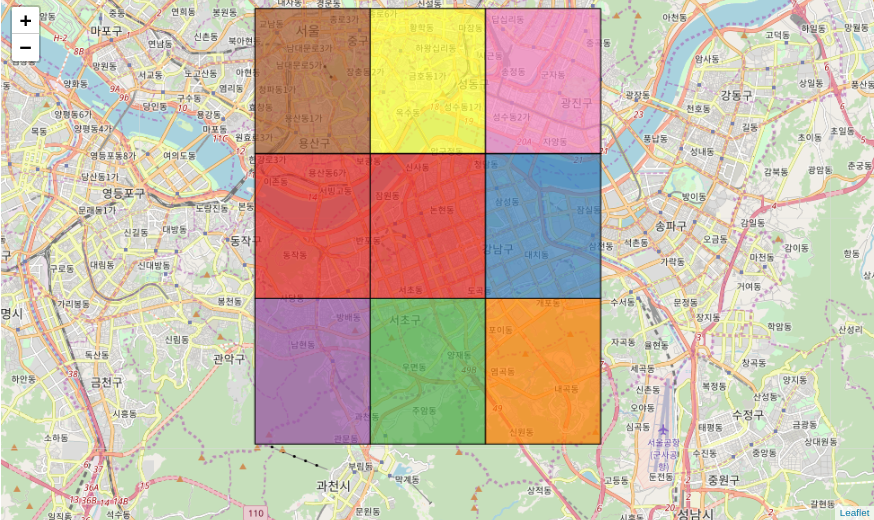
WebBrowser
지도를 HTML파일 형태로 저장한 다음에, 웹브라우져에서도 확인할 수 있습니다.
import webbrowser

m.save('map.html')
webbrowser.open('map.html')
Color Maps
import branca.colormap as cm

step = cm.StepColormap(
    ['green', 'yellow', 'red'],
    vmin=3, vmax=10,
    index=[3, 4, 8, 10],
    caption='step'
)

linear = folium.LinearColormap(
    ['green', 'yellow', 'red'],
    vmin=0, vmax=1
)

display(step)
display(linear)
display(cm.linear.Accent_03.scale(0, 24))
display(cm.linear.Accent_08)
display(cm.linear.Blues_03)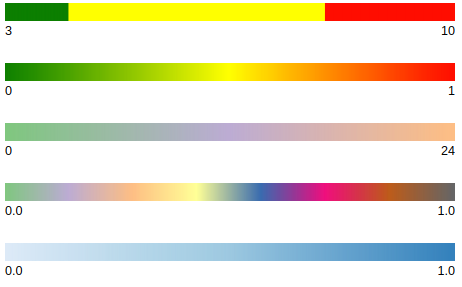
Tiles
Folium은 다음의 tiles들을 사용 가능합니다.
- openstreetmap (기본값)
- Stamen Toner (블랙 & 화이트)
- cartodbdark_matter (블랙)
- stamenwatercolor (주황색)
- Mapbox Bright (밝은 바닐라 크림색 - 거의 흰색)
- cartodbpositron (밝은 회색빛.. 화얀색)
타일 변경시 두가지 방법으로 변경 가능합니다.
m = folium.Map((37.5387343, 127.07511967), tiles='Stamen Toner')
또는
folium.TileLayer('Stamen Toner').add_to(m)
m = folium.Map((37.53873434027448, 127.07511967328423), tiles='cartodbpositron')
# folium.TileLayer('Stamen Toner').add_to(m)
m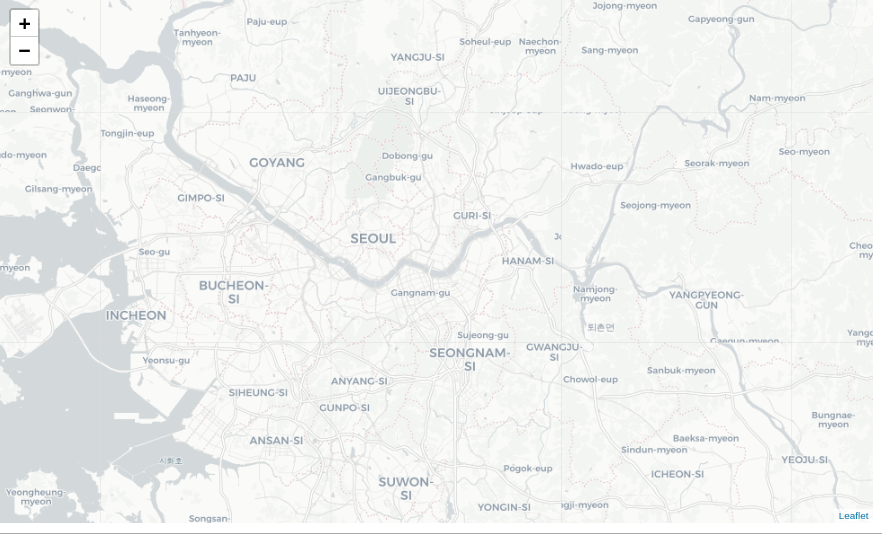
Adding m meters to latitude and longitude
Latitude 그리고 Longitude에 더하고 빼기는 다음과 같이 합니다.
def add_meter(lat, lng, lat_meter, lng_meter):
    new_lat = lat + (lat_meter/1000/6359.0899) * (180/np.pi)
    new_lng = lng + (lng_meter/1000/6386) * (180/np.pi) / np.cos(lat * np.pi/180)
    return new_lat, new_lng
m = folium.Map(location=(lat, lng), zoom_start=12)
lat, lng = 37.499402, 127.054207
folium.Marker((lat, lng), popup='<b>A</b>').add_to(m)
new_lat, new_lng = add_meter(lat, lng, 500, 500)
folium.Marker((new_lat, new_lng), popup='<b>500m</b>').add_to(m)
print('500m addition')
print('Latitude Addition:', distance((lat, lng), (new_lat, lng)).m)
print('Longitude Addition:', distance((lat, lng), (lat, new_lng)).m)
print('Both Addition:', distance((lat, lng), (new_lat, new_lng)).m)
new_lat, new_lng = add_meter(lat, lng, 1000, 1000)
folium.Marker((new_lat, new_lng), popup='<b>500m</b>').add_to(m)
print('1000m addition')
print('Latitude Addition:', distance((lat, lng), (new_lat, lng)).m)
print('Longitude Addition:', distance((lat, lng), (lat, new_lng)).m)
print('Both Addition:', distance((lat, lng), (new_lat, new_lng)).m)
print()
new_lat, new_lng = add_meter(lat, lng, 5000, 5000)
folium.Marker((new_lat, new_lng), popup='<b>500m</b>').add_to(m)
print('5000m addition')
print('Latitude Addition:', distance((lat, lng), (new_lat, lng)).m)
print('Longitude Addition:', distance((lat, lng), (lat, new_lng)).m)
print('Both Addition:', distance((lat, lng), (new_lat, new_lng)).m)
print()
new_lat, new_lng = add_meter(lat, lng, 10000, 10000)
folium.Marker((new_lat, new_lng), popup='<b>500m</b>').add_to(m)
print('10000m addition')
print('Latitude Addition:', distance((lat, lng), (new_lat, lng)).m)
print('Longitude Addition:', distance((lat, lng), (lat, new_lng)).m)
print('Both Addition:', distance((lat, lng), (new_lat, new_lng)).m)
print()
new_lat, new_lng = add_meter(lat, lng, 50000, 50000)
folium.Marker((new_lat, new_lng), popup='<b>500m</b>').add_to(m)
print('50000m addition')
print('Latitude Addition:', distance((lat, lng), (new_lat, lng)).m)
print('Longitude Addition:', distance((lat, lng), (lat, new_lng)).m)
print('Both Addition:', distance((lat, lng), (new_lat, new_lng)).m)
print()
# Visualization
m500m addition
Latitude Addition: 500.00005283004964
Longitude Addition: 500.0049490970048
Both Addition: 707.0996972853251
1000m addition
Latitude Addition: 1000.0004879418325
Longitude Addition: 1000.0098977428217
Both Addition: 1414.178421176091
5000m addition
Latitude Addition: 5000.017733038395
Longitude Addition: 5000.049416527164
Both Addition: 7070.052813071016
10000m addition
Latitude Addition: 10000.073709301136
Longitude Addition: 10000.098381885806
Both Addition: 14138.005608237756
50000m addition
Latitude Addition: 50001.900230356274
Longitude Addition: 50000.41972205647
Both Addition: 70605.6694353784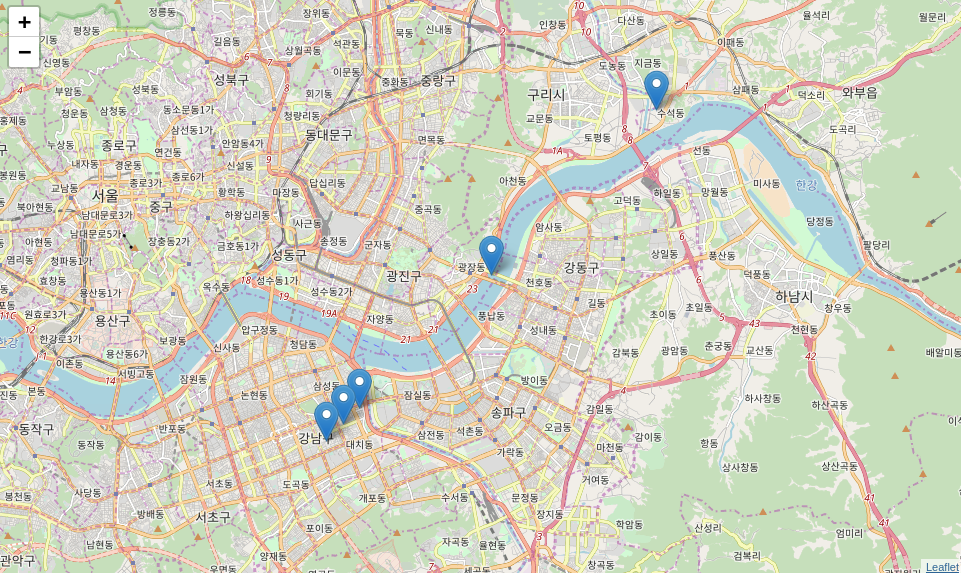
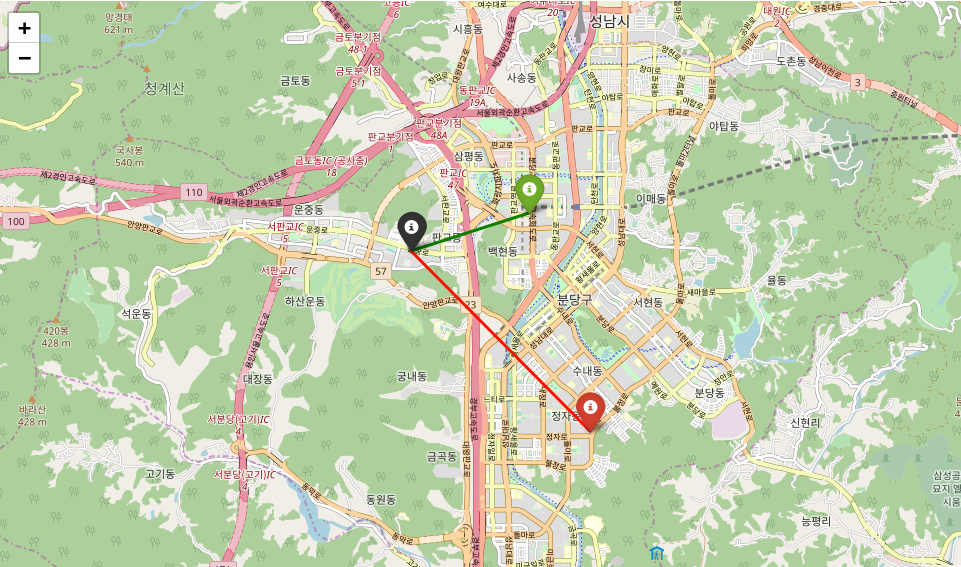
Angle Calculation
def calculate_angle(cur_location: np.ndarray, p1: np.ndarray, p2: np.ndarray) -> float:
    """
    :param cur_location: the current location of the latitude and the longitude.
    :param p1: (latitude, longitude)
    :param p2: (latitude, longitude)
    :return: float
    """
    ab = cur_location - p1
    ac = cur_location - p2

    _norm = np.linalg.norm(ab) * np.linalg.norm(ac)
    if _norm == 0:
        return 0

    _direction = np.dot(ab, ac) / _norm
    _direction = min(max(_direction, -1), 1)
    angle = np.arccos(_direction)
    angle = np.degrees(angle)
    angle = np.nan_to_num(angle)
    return round(float(angle), 4)

a = np.array([0, 0])
b = np.array([3, 0])
c = np.array([0, 3])

calculate_angle(a, b, c)  # 90.0
a = np.array([37.388641, 127.092138]) # Current location
b = np.array([37.393937, 127.112294]) # Location
c = np.array([37.364100, 127.122811]) # Call
angle = calculate_angle(a, b, c)
print('Angle:', round(angle, 2))
m = folium.Map(location=a, zoom_start=13)
folium.Marker(a, popup='<b>A Current Location</b>', icon=folium.Icon(color='black')).add_to(m)
folium.Marker(b, popup='<b>B Favorite Off Location</b>', icon=folium.Icon(color='green')).add_to(m)
folium.Marker(c, popup=f'<b>C Call {int(angle)} degree</b>', icon=folium.Icon(color='red')).add_to(m)
folium.PolyLine([a, b], color='green').add_to(m)
folium.PolyLine([a, c], color='red').add_to(m)
mAngle: 53.38